def make_demo_adata(seed=7):
"""
Simulates 5 samples with different temporal patterns in gene expression.
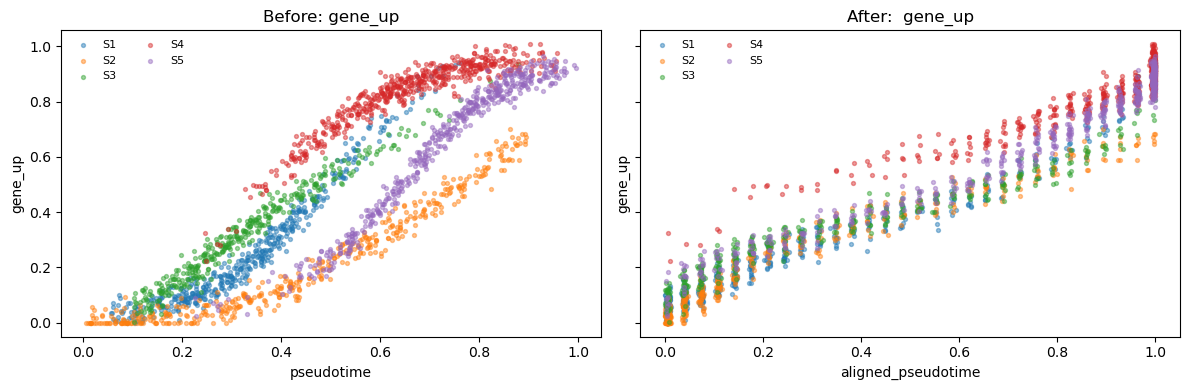
- gene_up: a sigmoid function that increases from 0 to 1 as the canonical time increases
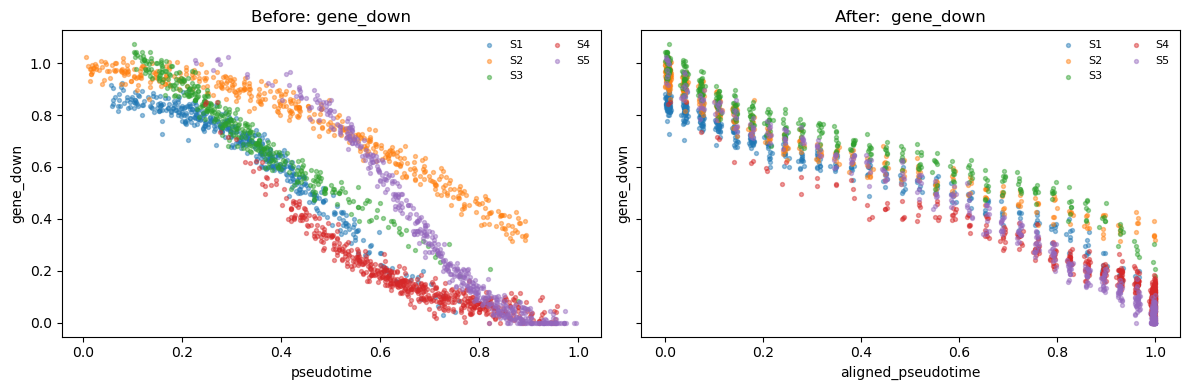
- gene_down: a sigmoid function that decreases from 1 to 0 as the canonical time increases
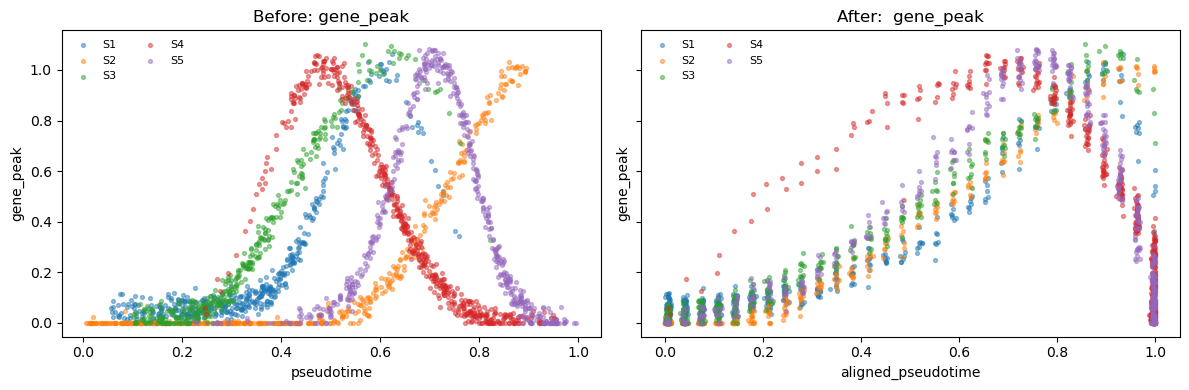
- gene_peak: a Gaussian function that peaks at a specific canonical time
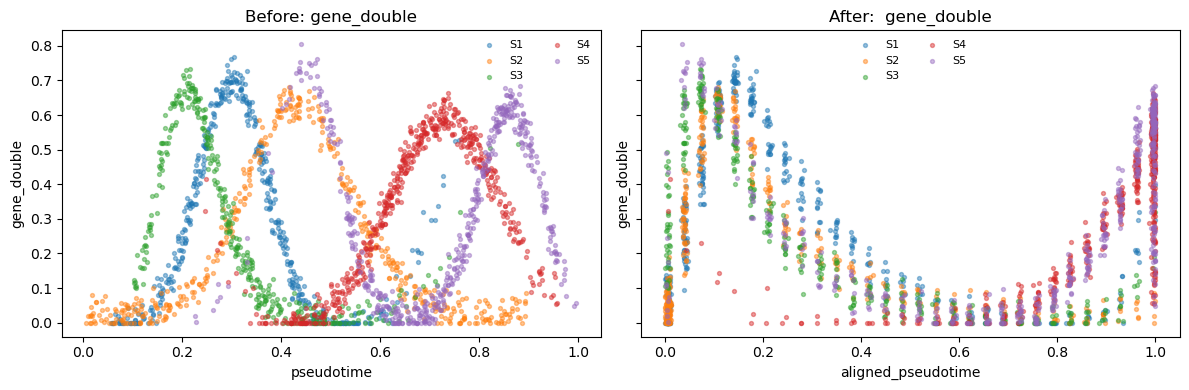
- gene_double: a combination of two Gaussian functions that peak at different canonical times
"""
rng = np.random.default_rng(seed)
# ----- gene programs on canonical time u in [0,1]
f = {
"gene_up": lambda u: 1 / (1 + np.exp(-8 * (u - 0.5))),
"gene_down": lambda u: 1 / (1 + np.exp(8 * (u - 0.5))),
"gene_peak": lambda u: np.exp(-((u - 0.6) ** 2) / 0.02),
"gene_double": lambda u: 0.7 * np.exp(-((u - 0.3) ** 2) / 0.01) + 0.6 * np.exp(-((u - 0.8) ** 2) / 0.015),
}
genes = list(f.keys())
# ----- sample-specific monotone warps (nonlinear)
warps = [
lambda t: t,
lambda t: np.where(t < 0.5, 0.7 * t, 0.35 + 0.6 * (t - 0.5)), # slow→fast
lambda t: np.clip(t + 0.08 * np.sin(2 * np.pi * t) + 0.1 * t * (1 - t), 0, 1), # smooth S
lambda t: t**0.7, # late dilate
lambda t: t**1.5, # early dilate
]
samples = [f"S{i + 1}" for i in range(len(warps))]
n_per = [450, 500, 400, 520, 480] # uneven cell counts
betas = [(3, 6), (1, 1), (2, 5), (6, 3), (5, 2)] # Beta densities
crops = [(0.05, 0.95), (0, 0.9), (0.1, 1), (0, 1), (0.15, 1)] # partial overlap
X_list, obs_list = [], []
for sid, warp, (a, b), n, (lo, hi) in zip(samples, warps, betas, n_per, crops, strict=False):
t = np.sort(rng.beta(a, b, size=n))
t = t[(t >= lo) & (t <= hi)] # crop to simulate partial overlap
u = warp(t) # canonical time (ground truth)
amp = rng.normal(1.0, 0.05, len(genes)) # per-sample gene amplitude
base = rng.normal(0.0, 0.03, len(genes)) # per-sample baseline
expr = np.vstack(
[np.maximum(amp[j] * f[g](u) + base[j] + rng.normal(0, 0.03, len(t)), 0.0) for j, g in enumerate(genes)]
).T
X_list.append(expr)
obs_list.append(pd.DataFrame({"sample": sid, "pseudotime": t, "canonical_time": u}))
X = np.vstack(X_list)
obs = pd.concat(obs_list, ignore_index=True)
var = pd.DataFrame({"gene": genes}).set_index("gene")
return AnnData(X, obs=obs, var=var)
# Create the dataset for your demo notebook
adata = make_demo_adata()